
Processing Time —
Madeleine and I took part in the Processing Time code jam yesterday, and won a prize! Processing is a programming language for creating data visualizations, which Mad’s been using to create graphs for papers recently. Our entry was a program that takes a description of a tree (in Newick format) and draws it, allowing you to zoom in to explore large trees.
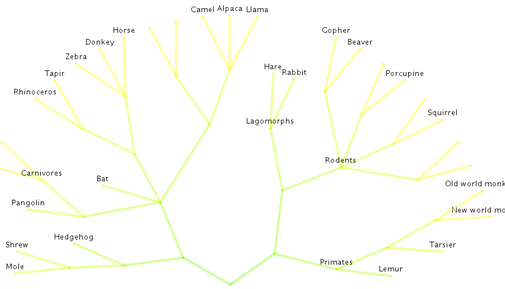
The example we used, and the motivation for creating the program, was the phylogenetic tree of life. Since creating this comic, Mad’s wanted a way to create a zooming interface to explore the same, but we didn’t get around to it until we were put in the setting of having four hours to code and then present something. It was a lot of fun; I did the boring part of walking a tree recursively, and Mad worked out the geometry for a radial graphing algorithm that splits points along the edge of a semi-circle equally between end leaves of the tree.
For now, the code’s in this Processing sketch archive, but we’re hoping to make an applet out of it soon. Hat tip to the authors of TreeJuxtaposer, whose Newick format parser we used.
Here’s the obligatory screenshot — zoomed in on part of the mammals section — which isn’t very exciting since the whole point is to explore the tree interactively:
Thanks to the organizers and other participants for such a fun day; it’s great to be given motivation to work on something fun, and lovely to be recognized for it too.
Sound very interesting. I’d love to see it in action.
I made a similar program a while back: http://www.vandenoever.info/software/warptree/
Gee I love graph theory 🙂
This is particularly awesome, I assume you didn’t deduce the entire layout algorithm in the timeframe and used a standardish method of doing it? Non the less it’s very impressive.
When doing my Kamada Kawai implementation recently it took about 12 hours converting it from someone else’s source.
@Jos, really impressive warptree there too 🙂
Mad did deduce it while we were there, actually. I was going to object and point out that there are entire PhD theses written on graph layout algorithms and OMG what was she thinking, but then she pointed out that she’d finished coding it and could I please hurry up providing her that tree-walking API I seemed to be spending a lot of time on. 🙂
The rendering algorithm is very simple — you might be able to deduce it from looking at the screenshot. The algorithm uses radial coordinates, spacing each of the endpoints out with equal angular distance on a semicircle. The radius is determined by depth, and a parent’s angle is the average of child node angles.
Yeah I can see how it works now 🙂 That’s pretty good, and pretty crazy to do a new algorithm in that time.
Tryly 1337 🙂
Very cool! I played a rousing game of “find the human” (it went something like: click, r, click, r, click, r, etc).
The drawTree algorithm creates some beautiful trees!
My brother Greg worked on something similar in Processing for GSoC 2007 http://www.phylowidget.org/
Thanks, Brian! There’s a much better version at [http://exploretree.org/](http://exploretree.org/) now.
Fun coincidence about PhyloWidget; it looks excellent.